ABSTRACT
With sustainability goals in mind, UBC wishes to reduce automobile trips to and from the UBC Vancouver campus, and encourage the use of other modes of transportation, including transit (UBC Vancouver Transportation Status Report Fall 2017). It is expected that extending the Millennium Line SkyTrain to UBC will increase capacity for passengers, while also minimizing carbon emissions and increase access to affordable housing. In fall 2017 the average Weekday Person Trips to and or from UBC Vancouver was 81,400 people, a +328.4% increase since 1997 (UBC Vancouver Transportation Status Report Fall 2017). Campus population has also increase since then, therefore more passengers taking the transit. It’s difficult to see if population has impact on the amount of people taking the transit rather than more people choosing transit over driving a vehicle. Currently the 99 B-Line route on the Broadway Corridor is the busiest and most congested bus route in Canada moving up to 60,000 transit customers a day on articulated buses that run every 2-3 minutes in peak times (Translink). Phase 1 of the extension from Commercial-Broadway to Arbutus has been completed and our project focuses on phase 2, which is extending the line from Arbutus to UBC.
- DESCRIPTION OF PROJECT
The UBC line rapid transit is a suggested Skytrain extension during its phase 2 evaluation (Translink, n.d.), further extending the phase 1 project which extends from Commercial-Broadway Millennium line to Arbutus street, along the Broadway corridor. The extension of the “Broadway Subway” (“Rail to UBC Rapid Transit Study”, 2019) further into the UBC hub is a hotly debated topic amongst different communities in the Vancouver and Metro Vancouver region. Some debates include logistics such as the decision over a tunnelled versus elevated line (Chan, 2018; Ohrn, 2018). While some debates consists of social issues such that the Skytrain extension will promote affordable housing (Gil Kelley cited in Commisso, 2018) versus a strong opposition by Condon (2019), stating that the Skytrain extension will only widen the gap between the rich and the poor in Vancouver.
This undergraduate student-led GIS project looks into the social implications of the proposed UBC line rapid transit route that extends from East Broadway at Commercial drive to UBC Exchange or transit loop. The proposed UBC transit route will be running from the ‘best route’ after a study of 200 possible route options (Phase 1 Evaluation Report, 2010). This rapid transit line is replacing the high frequency, articulated 99 B-line buses that correspondingly runs in the same corridor as the proposed rapid transit route. The social implications of focus, in relation to the UBC line rapid transit, will be the evident trend on housing affordability, parallel to the ridership density. These geospatial data project a possibly correlating course wherein the more affordable housing zones in Vancouver have, similarly, higher volume of public transit commuters. This project will aim to answer the following questions: will a fully developed Skytrain extension promote housing affordability as suggested by “UBC Rapid Transit: Access to Affordable Housing” (n.d.)? And is there a trend between the cost of housing in an area and the increased volume of public transit ridership? The areas that are most expensive also have the least amount of people using the transit. This could be correlated with wealth, and that wealthier people can afford to travel by car rather than transit.
- METHODOLOGY
Map of the Proposed UBC line:
Acquire DA map from Abacus Dataverse Network
- Search ‘Census Canada 2016 boundary files’ > ‘Data & Analysis’
Acquire transit routes from Abacus Dataverse Network
- Search ‘Transit Routes’
- Data name: Translink Transit GIS Data, 21 April 2017’
- ‘Data & Analysis’ and download ‘Shapes_Trips_Routes_shp.zip’ and ‘Stops_shp.zip’
- Extract both in folder and add into the geodatabase
Acquire rapid transit routes from City of Vancouver: Open Data Catalogue
- Download ‘Rapid Transit Lines’ and ‘Rapid Transit Stations’
- Extract in folder and in file geodatabase
Filtering data: Add CT, DA, Trip Routes, and Trip stops as layers in the TOC of ArcMap. Isolate 99 B-line route since this is our area of interest
- Right-click on the layer name ‘Bus_Routes’, select ‘Open Attribute Table’ > ‘Select by Attributes’ > “trip_heads” = ’99 UBC B-LINE’ > Apply
- Right-click again on the same layer, ‘Selection’ > ‘Create Layer From Selected Features’
Adding transit stops along the UBC line rapid transit route:
- Right-click on ‘Bus_stops’ > ‘Open Attribute Table’ > ‘Select by Attributes’ >
“stop_desc” IN ( ‘UBC Exchange @ Bay 4’ , ‘University Blvd @ Allison Rd’ , ‘W 10 AVE @ Sasamat St’ , ‘Alma St @ W 10 Ave’ , ‘Macdonald St @ W Broadway’ , ‘Arbutus St @ W Broadway’ , ‘W Broadway @ Granville St’ , ‘W Broadway @ Willow St’ , W Broadway @ Cambie St’ , ‘Main St @ E Broadway’ , ‘E Broadway @ Fraser st’ , ‘E Broadway @ Clark Dr’ , ’E Broadway @ Commercial Dr’ )
- Right-click on the same layer, ‘Selection’ > ‘Create Layer From Selected Features’. We named the layer “Commercial_UBC_StationsMK”
Map of shelter cost in 2016 in relation to UBC Transit Line:
- Create a new dataframe that includes all preceding layers except the Vancouver map itself. Add ‘lhy_000h16a_e.shp’ and ‘lhy_000c16a_e.shp’ for the ocean and rivers layers from the previous CT 2016 boundary files located in Abacus Dataverse Network. Unite the two files with the Union tool to create one layer for Canada’s overall water areas; we named it ‘Ocean’.
- Acquire the appropriate CT map from Canadian Census Analyser (https://www.datacentre.chass.utoronto.ca/cgi-bin/census/2016/displayCensus.cgi?year=2016&geo=ct)
- Select: Vancouver (B.C) > Click on ‘Housing’ tab > Tick box for ‘Median value of dwellings’ > On ‘Select the output format’, click ‘dBase (DBF) file’
- Exclude areas valued at $0. Properties > Symbology > Classify > Exclusion > ‘COL1 < 1’ > OK
Map of public transit ridership in 2016:
- Create a new dataframe including all other layers except the CT map featured in shelter cost 2016.
- Acquire the appropriate CT map from Canadian Census Analyser
Uncheck all previous selected items except for Vancouver (B.C). Click the ‘Journey to Work’ tab > Tick box for ‘Public Transit’, and accept the same defaults as shelter cost data.
Table 1: Original datasets
| Datafile name | Source | Uses | Data model | Attributes | Modifications |
| Lct_000b16a_e | Canadian Census Analyser | General map of Vancouver for Proposed UBC Line | Vector polygon | FID*, CTUID, CTNAME, PRUID, PRNAME, etc | Project, Select by Attribute, export selected features, join ‘shelter’ table. In a different dataframe: join ‘public transit’ table |
| Bus_Routes
Renamed to: Commercial_UBC_RouteMK |
Abacus Dataverse Network | Shows Vancouver and Metro Vancouver bus routes | Polyline | OBJECTID*, Shape_id, route_id, service_id, route_url, etc. | Select Attributes, export selected features to a new layer |
| Rapid_transit_line | City of Vancouver: Open Data Catalogue | Maps out the LRTs in Vancouver and Metro Vancouver; Millenium line, Expo line, and Canada line | Polyline | FID*, Shape*, LINE, Shape_length | |
| Bus_stops. Renamed to: Commercial_UBC_StationsMK | Abacus Dataverse Network | Shows bus stop points throughout Vancouver | Point | OBJECTID*, stop_id, stop_code, stop_name, etc. | Select by Attribute, export selected features to a new layer |
| Rapid_transit_stations | City of Vancouver: Open Data Catalogue | Shows LRT stop points throughout the LRT routes | Point | FID*, Shape*, Station | |
| Journey to Work
Renamed to CanadaCT_2016publictransit |
Canadian Census Analyser | Census data to show number of people using public transit in Metro Vancouver | Tabular | Public_transit | Join table to general map of Vancouver, export data to create new layer (CanadaCT_2016publictransit) |
| Median value of dwellings
Renamed to CanadaCT_2016joinMMKshelter |
Canadian Census
Analyser |
Census data to show cost of housing in Metro Vancouver | Tabular | COL1 | Join table to general map of Vancouver, export data to create new layer (CanadaCT_2016joinMMKshelter) |
- DISCUSSION AND RESULTS
What does the 99 B-line ridership look like currently? And will this increase with the development of the new UBC transit line?
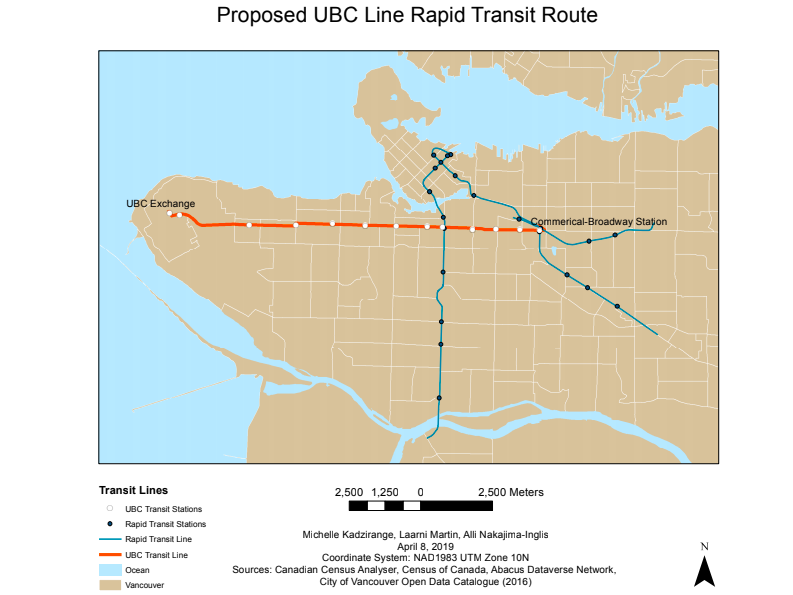
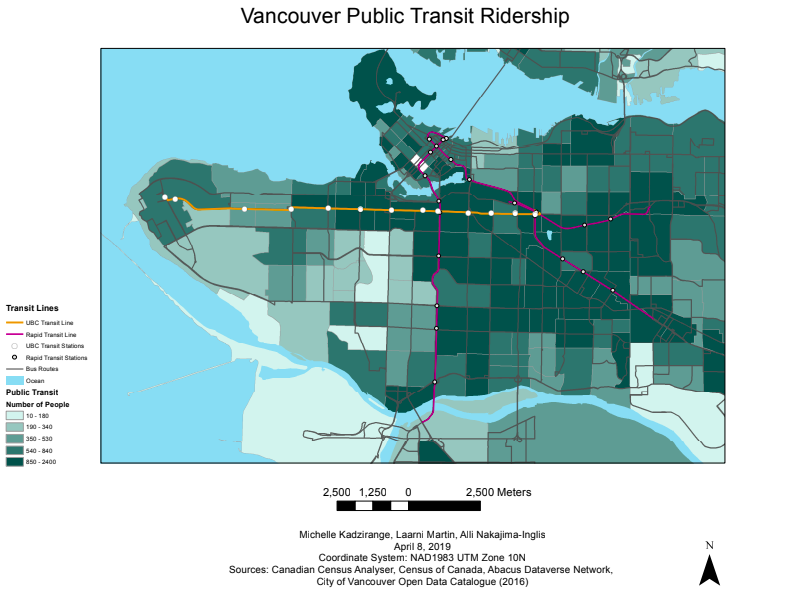
Maps 1 and 2 (“Proposed UBC Line Rapid Transit Route” & “Vancouver Public Transit Ridership”):
Three maps were created in order to see where the proposed UBC line would be constructed and to illustrate any correlations between the areas where public transit is used the most and housing affordability. The proposed line will start from the Commercial-Broadway Station to the UBC Exchange. The first map was created to show the proposed UBC Rapid Transit Route. This map illustrates the areas that the line would be passing through and which areas would be connected from UBC to the Commercial-Broadway Station. Map 1 shows that the proposed UBC transit line would be connected to both the Canada Line and the Expo Line, which for the purpose of this study, are called the rapid transit lines. Such a proposed transit route has important implications for UBC faculty, staff and students. This is because, by having an additional connected transit line to the rapid transit line, people from UBC would have easier and faster access to the rest of Metro Vancouver, along with other cities such as Richmond and important places like the Vancouver International Airport (YVR). However, although this map demonstrated the areas that the proposed line would be passing through, it was also important to visualise the busiest public transit areas, in order to access whether this was the best proposed route to construct the transit line. Thus, a second map was created to illustrate the public transit commuting flows in Metro Vancouver 2016. This map confirmed the studies that reported that the 99 B-line bus route is the busiest bus route in Canada and the US. According to a report by the City of Vancouver (2010), the 99 B-Line route on the Broadway Corridor is the busiest bus route in Canada and the United States, moving up to 60,000 transit customers a day on articulated buses that run every 2-3 minutes in peak times. Even with buses running this frequently, it is also the region’s most overcrowded bus route. This map shows the areas of the busiest traffic flows and illustrates that the Commercial-Broadway to UBC bus route is busiest route because it has the most people travelling along this route as is shown in the dark green areas. This map further suggests that there is a large number of UBC students commuting to UBC along this line.
Access to affordable housing: Metro Vancouver neighbourhoods?
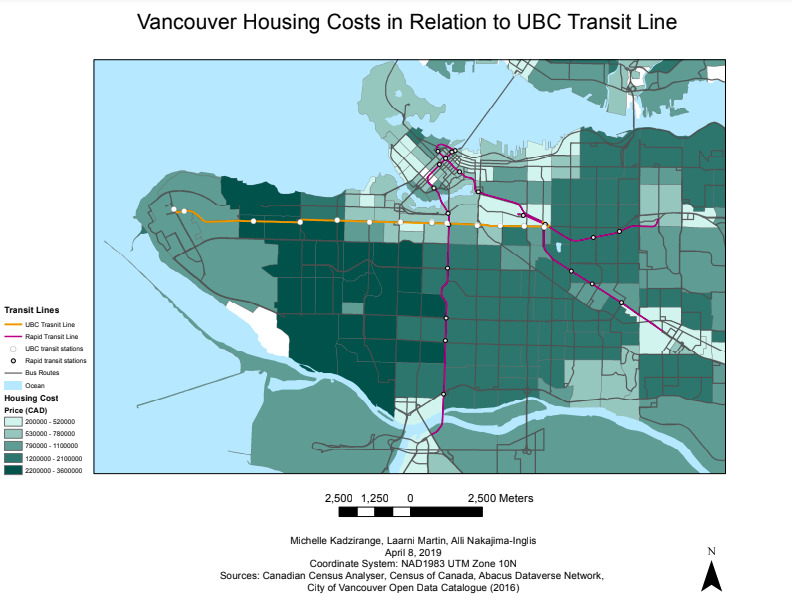
Map 3 (“Vancouver Housing Costs in Relation to UBC Transit Line”):
The third map was created in order to illustrate the affordable neighbourhoods or areas that would be accessible to UBC students living off campus. This map shows that if the proposed UBC line were constructed, it would provided easy and better access to areas in Metro Vancouver that are more affordable for UBC students who are unable to live on campus. For example, in 2017 about 6,000 students were on the waiting list for on campus housing at UBC and this is largely due to the housing affordability problems in Metro Vancouver (Correia). Thus, this map not only illustrates the housing prices across Metro Vancouver, but it also shows the areas that UBC students could potentially have access to for affordable housing. For example, the following neighbourhoods that are considered affordable for UBC students are Fairview, Mount Pleasant, Renfrew Collingwood, Killarney, Kensington-Cedar Cottage, Riley Park, Sunset, South Cambie, Strathcona, Granview-Woodland. In order to see whether these areas were both affordable and easily accessible via the UBC transit line, another vector data of neighbourhoods in Metro Vancouver was used to see where the least expensive areas were. Interestingly, some of these areas were along the UBC proposed line such as Mount Pleasant and Fairview. However, generally, the least expensive neighbourhoods such as Renfrew-Collingwood, Kensington-Cedar Cottage, Strathcona and Killarney, were much further away from the UBC line. Although this could be a disadvantage for living in these areas, these neighbourhoods were also in close proximity to the rapid transit lines such as the Millenium Line and the Expo Line, which would be connected to the UBC transit line.
UBC Transit Line projected to provide what other services? (number of students using transit line, benefits i.e time taken travelling to and from UBC, access to other important areas in Vancouver)
According to the University of British Columbia (“Connecting the Region”, n.d.), the phase 2 extension of the Broadway Subway further into the UBC hub will enhance regional connectivity, seeing that UBC is the “third largest employment centre in BC”. Laterally, Central Broadway is the second largest employment center in the province of BC according to a report by the City of Vancouver (2010). Connecting these two largest districts with a single rapid transit line will promote a more fluid exchange of innovative ideas as more people can commute at ease from one area to the other. In a phase 1 evaluation report of Translink (2010), the “Projected Real Population Growth (2006-2041) exhibits a massive increase in the False Creek and Mount Pleasant area, instigating a trend in housing expansions farther East. As evident in maps 2 and 3 that we created, the trend shows that the farthest neighbourhood in the Broadway Corridor- described to as “roughly 500 metres north and south of Broadway/10th avenue, from Commercial Drive to UBC” (City of Vancouver, 2010), to the east represents the lowest housing cost. In association to this housing trend, our “Vancouver Public Transit Ridership” depicts the highest volume of public transit users in the east-most side of the Broadway Corridor, bordering Broadway-Commercial station. Due to the undeniably unaffordable housing and rentals in much of Vancouver, many students and UBC staff are considering moving Eastward, where housing prices tend to be more affordable.
The extension of Millenium Line to UBC comes, possibly, more affordable pricing options for students and lower income households who are either employed in Central Broadway or UBC. However, these “housing affordability” defense brought by both City of Vancouver and UBC should be taken with a grain of salt. An argument put forth by Condon (2019), suggests that Vancouver has a knack for building unaffordable housing, such as the unaffordable condominiums in the “Living City” that will be located at the Oakridge mall area- just alongside Canada Line’s Oakridge stop. Due to the UBC Line’s expensive expansion, there is a possibility that the City of Vancouver will look into partially funding this cost through promoting high-rise constructions along the Broadway corridor, dotted with expensive real estate levies. Apart from the affordable housing and ridership topics, which are they key drivers of the Skytrain expansion; there are also cultural, academic, recreational, and health-related benefits to extending the Skytrain to UBC grounds (“Connecting the Region”, n.d.). For non-daily commuters to UBC, having the rapid transit line can promote visitors in the regions, some of which find commuting towards the UBC bubble a hindrance to visiting the district.
The new proposed Transit line will also provide more space and accessibility for people who commute to and from UBC. Currently, the 99-B line is the most crowded and frequently used bus in Vancouver. The rapid transit expansion will improve travel times for people and along the corridor and elsewhere by reducing congestion. Population in Vancouver is expected to grow and the Expansion project is expected to meet this challenge to provide capacity and increasing the options for affordable housing.
- ERROR AND UNCERTAINTY
One area of error that was present was the use of different projections during the creation of the various maps. When we were adding the bus route and bus stop layers, there were several warning error messages that came up and warned us to change the projection of these layers in order to align with the proper geographic coordinate system: NAD 1983 UTM Zone 10N. The bus route layer did not allow us to transform its geographic coordinate system to align with that of the Data Frame (UBCLine). Although we did not calculate the areas or lengths of the map, this would be a potential area of error if we had to make such calculations. Another area of uncertainty was the use of two different classification system for the housing map and the public transit map. In the housing map, the Equal Interval classification was used to represent the housing prices. For the public transit map, the natural breaks was used to represent the number of people using public transit in Metro Vancouver. These two types of classification were used as they illustrated the pattern and correlation better than the other types. Thus, ethical questions would be raised as to whether or not it was ethical correct to choose specific classifications to better represent the correlations we wanted to show. Another area of uncertainty was the selection of UBC stops along the the proposed transit line. This is because there were too many stops along the line because the table made for these stops showed both directions of the stops. This meant that certain stops had two instead of one, whilst others only had one. To fix this problem, we had to manually select the individual stops we wanted to show along the line and this is where an area of human error could arise from accidentally missing one stop. It is difficult to tell if the people that are not using the transit are using eco friendly modes of transportation. For instance areas like Kitsilano have least amount of people using the transit, however, people could be commuting by bike or car. There also uncertainty with the Census Tracts since, they are updated every 5 years. Our maps for housing and is not up to date.
- FURTHER RESEARCH/RECOMMENDATIONS
One area we would have wanted to investigate was how much time would be saved from using the proposed UBC transit line rather than the 99-B line buses. This would be important research to further support the significance of the construction of such a line as it would show how much more time efficient using a rapid transit along this line would be. By creating various maps comparing the average time taken to travel from Commercial-Broadway Station to UBC, we would be able to effectively represent the benefits of having a UBC transit line.
Another potential area to do further research would be analysing the reduction in the Greenhouse Gas (GHG) emissions of the new proposed UBC transit line relative to the current 99 B-line diesel bus that runs from Commercial Drive through Broadway and into UBC loop. It would be interesting and important to ask the following questions:
- What are the emissions per kilometre of the proposed UBC transit line versus 99 B-line bus route? Inclusive of emissions throughout vehicle production and maintenance. Although the proposed UBC transit line would be electric like the other rapid transit lines, it would be interesting to see whether the sources of electricity for this transit line have low greenhouse gas emissions. Another area to research in relation to the greenhouse gas emissions of the proposed line would be how much energy is saved by having the proposed UBC line, in comparison to the average energy use of the 99-B line buses.
- What are the pollution levels within the buffer zone of the transit corridor during construction and at normal operations?
- Will there be a short increase in GHG emissions during construction phase along the corridor, additionally due to traffic? Or will this usual traffic density shift towards a different route, possibly shifting GHG emission buffer zone?
Bibliography
Alternatives Analysis Summary & Update: Rail to UBC Rapid Transit Study. (2019, January). McElhanney. Retrieved from https://www.translink.ca/-/media/Documents/about_translink/governance_and_board/council_minutes_and_reports/2019/january/2019_01_24_technical_report_rail_to_ubc.pdf
Chan, Kenneth. (2018). This is why the Broadway Extension can’t be elevated Skytrain. Dailyhive. Retrieved from: https://dailyhive.com/vancouver/millennium-line-broadway-extension-elevated-skytrain
City of Vancouver: Administrative Report. (2010). Retrieved from: https://council.vancouver.ca/20101005/documents/ttra1.pdf
Commisso, Tanya. (2018). City of Vancouver aims to curb land speculation along Broadway Corridor. Vancourier. Retrieved from: https://www.vancourier.com/real-estate/city-of-vancouver-aims-to-curb-land-speculation-along-broadway-corridor-1.23314576
Condon, Patrick. (2019). Am I the Last Voice Against Skytrain to UBC?. The Tyee. Retrieved from: https://thetyee.ca/Opinion/2019/01/29/Last-Voice-Against-SkyTrain-to-UBC/
Correia, Cory. “Lower Mainland universities grapple with long wait lists for student housing”. CBC. August 23, 2017. Retrieved from https://www.cbc.ca/news/canada/british-columbia/ubc-sfu-waitlist-students-housing-1.4256721
Ohrn, Ken. (2018). Vancouver’s Broadway Rapid Transit- Elevated or Tunneled?. Pricetags. Retrieved from: https://pricetags.ca/2018/09/13/vancouvers-broadway-rapid-transit-elevated-or-tunneled/
The University of British Columbia. UBC Rapid Transit: Access to Affordable Housing. Retrieved from: https://skytrain.ubc.ca/impact-benefits/access-to-affordable-housing/
The University of British Columbia. UBC Rapid Transit: Connecting the Region. Retrieved from: https://skytrain.ubc.ca/impact-benefits/connecting-the-region/
Translink. ( 2010, February). Phase 1 Evaluation Report. Retrieved from https://www.translink.ca/-/media/Documents/plans_and_projects/rapid_transit_projects/Millennium-Line-Broadway-Extension/phase_1_ubc_line_rapid_transit_study_evaluation_report.pdf?la=en&hash=C70BCBF5117B9F966EB276D041C5941AE850C319